
|
Station Leningradskaya |
| Station synoptic index | 89657 |
| Meteorological site height above sea level | 304 m |
| Geographical coordinates | 69°30’ S, 159°23’ E |
Topography and local environment
The Leningradskaya station (opened in February 1971) is situated at the Oates Coast with coordinates of 69°30’ S, 159°23’ E. Its height above sea level is 304 m and the synoptic index is 89657. The station buildings are located in the ice-free area at the nunatak top. The station area is the least studied in synoptic respect. It is characterized by a close proximity to the area of climatic cyclone that is usually located above the Ross Sea, as well as by unique local conditions influencing the weather processes. The station is known by its persistent and frequent storms that occur due to its considerable elevation above sea level.
The station structures consist of several houses with living space, a radio-station, a power station, a meteorological station, an upper-air sounding complex, a garage and a warehouse. The living and life conditions are quite peculiar. The station territory is restricted having only 200-250 m in length and not more than 50 m in width. The station is resupplied by vessels that stop far from the station in drifting ice or near landfast ice. The personnel and cargo are delivered to the station by helicopters.
The Leningradsky nunatak presents a rocky feature. Its ridge is comprised of alternating leucocratic granites and grey biotite gneiss extending from east to west over 1 km at a width of 100-150 m. Snow covers 2/3 of the nunatak area. The station is located in the western nunatak area at a distance of 600 m from its top (330 m). The nunatak height comprises 100-230 m relative to the surrounding glaciers. The ice barrier in this area has a height of 15-20 m.
[top]
General characteristics of synoptic processes in the Leningradskaya station area
It is known that at high latitudes of the Southern Hemisphere, a zonal displacement of the cyclonic pressure features prevails. However, large pressure ridges are quite frequent developing from north to south and sometimes combining with the Antarctic High ridges creating thus a blocking effect and causing the displacement of cyclones in the meridional direction. One of the areas where the displacement of cyclones with the southerly components are most frequently observed is the Australian-New Zealand sector. In the area between 140 to 170o E, there is a change in the direction of displacement of cyclones that persist then in the Ross Sea. Note that the cyclones of the Australian-New Zealand sector have large energy supplies as the warm air outflow from the north and cold air sinking from Antarctica contribute to their regeneration. As to the Oates Coast and the George V Coast, the cyclones mainly pass above the oceanic regions in the zonal direction. However, from May to August up to 2-4 cyclones a month exit along the meridional trajectories from temperate and sub-tropical latitudes in the southeastern Indian Ocean.
[top]
Cyclonic meso-vortices
In most cases, cloud meso-vortices in the atmosphere of East Antarctica occur in the rear (in the southwest) of extensive polar front depressions when a cold polar front is displaced far to the north and the cold Antarctic air moves with the southern flows onto a comparatively warm water surface. In some cases, the conditions that are sufficient for the development of a mesoscale cyclogenesis are created above the ocean areas. The clockwise wind turn with height in the rears of depressions contributing to increased cyclonic circulation in the lower atmospheric layer probably also influences the formation process of meso-vortices. The frequency of occurrence of meso-vortices is probably lower near the Oates Coast, than in the Ross or Mawson Seas, but obviously they are generated with the development of the most active cyclonic features that moved here along the meridional trajectories from the northern oceanic areas.
During the warm period of the year, the sub-synoptic cloud vortices can in some cases generate near the coast and influence the weather in the vicinity of the Leningradskaya station. Typically, this is manifested in the wind increase to 10-15 m/s, running of low clouds of stratus forms and solid precipitation with deterioration of visibility. At a daily interval of satellite observations, a forecaster does not always notice such perturbations. As a rule, these phenomena are not long, but due to their sudden occurrence they can adversely influence aircraft operations. The dimensions of these meso-vortices formed typically of stratiform clouds comprise 200-300 km with duration of not greater than 2 days.
During the colder period, the area of the mesoscale cyclogenesis is displaced northward and cloud meso-vortices more frequently form near the northern boundary of drifting ice. At this time of the year, they are more active according to satellite images being in some cases similar to polar lows typical of the arctic polar water areas. These vortices do not usually reach the coast quickly degrading when moving above sea ice.
[top]
Surface wind and air pressure field
The Leningradskaya station is located in the zone of marine Antarctic climate with a rapid and sharp change of weather conditions. The main wind types in the coastal regions - cyclonic, catabatic and transient, are quite pronounced here, but they have their peculiarities, primarily in respect of the prevailing directions. The southeasterly winds in all months of the year steadily occupy the first place. Their frequency of occurrence varies around 50% decreasing only in May and June to 40-43%. The southerly winds are second by the frequency of occurrence, which comprises 18-13% increasing to 20-22% in autumn from March to April. The westerly winds are at the third place (8-12% in all months of the year) that together with the northwesterly winds are close by the frequency of occurrence to the southerly winds. The pronounced easterly winds at the coastal stations of East Antarctica (34% on average for a year at Mirny, 30% at Molodezhnaya, etc.) comprise vice versa only 6% at the Leningradskaya station. The wind rose attains the features more typical of the stations at much lower latitudes, for example, Bellingshausen. The increased frequency of occurrence of the westerly winds at Leningradskaya is related to three facts. First, the cyclones stationing above the Ross Sea at the specific processes, especially in summer, attain an easterly component, cross the Scott Coast and in rare cases reach the Victoria Land, an extensive plateau at the 1500-2200 m height. Second, some cyclones moving along the meridional trajectories from the northern oceanic areas (along the eastern Indian Ocean trajectory and the western Australian trajectory) exit to the George V Coast at a sufficiently large angle to the coastline also appearing sometimes above the Victoria Land. In both cases, the Leningradskaya station area becomes for some time at the northern periphery of the cyclone, i.e. in the zone of westerly transports. Third, the westerly winds can be observed in the event of a high pressure ridge moving to the Oates Coast from the north.
Strong winds, storms and snowstorms come to the station from the southeast. Average speeds in the colder time of the year comprise 8-9 m/s. In summer, this indicator decreases insignificantly, only by tenths. The number of days with a storm (with the 15 m/s wind speed) in autumn and winter months comprises 18-20 and in summer up to 14-16 days a month. The storm wind increases are especially frequent and long from June to September. The maximum wind speed for the 1971-1979 period was 48 m/s with the maximum gust of 60 m/s. The largest wind gusts were recorded on July 9, 1989 when under the conditions of persistent (several hours) storm the instrument recorded twice the maximum gust of 78.3 m/s. Between these readings, there was an instrument failure and there is no certainty that the wind gusts were not greater.
At the Leningradskaya station, there is no strict difference between the catabatic and cyclonic wind. It is difficult to determine the end of one wind and the beginning of another. This comment does not obviously refer to the case where the cyclonic wind is expressed in the form of westerly flows.
The main feature of the pressure fields of the Australian-New Zealand sector of the Antarctic is the presence in all seasons of the climatic cyclonic centers in the Ross and Mawson Seas. The average monthly pressure fields suggest the existence of either an increased pressure ridge or an isthmus between two cyclones in the Oates Coast area much of the year. In winter and spring, the climatic center from the east is located most closely to the Leningradskaya area whereas in summer and autumn, the direct influence of cyclones from the Mawson and D’Urville Seas increases.
[top]
Air temperature and the cooling factor
The formation of the temperature regime of Leningradskaya is influenced
significantly by local conditions, its elevation above sea level, as well
as the synoptic process features contributing to greater frequency of overcast
sky along with a significant number of cases with clear sky. The main factor
is a large frequency of occurrence of southerly and southeasterly winds from
the cold mainland. The mean annual temperature comprises –14.6o. This is
much lower than the temperature at the Molodezhnaya and Novolazarevskay stations,
but slightly higher than the mean temperature at Mirny. Compared to closely
located stations, the temperature at Leningradskaya is closer to Hallett
station than to Dumont D’Urville.
The mean monthly temperature for the observation period is characterized by
the below zero values at the minimum value of –21.7o in August and the maximum
value of –3.9o in January. The extreme values have a large dispersion between
–0.5o to –37.4o in August and 8.9o to –13.0o in January. A successful temperature
forecast depends on the correct taking into account the aforementioned features
and factors.
Low air temperature and wind are the main factors influencing the time
of stay or work of people in the open air. A complex assessment of weather
severity is typically expressed in points and is calculated by Bodman’s formula:
S=(I + 0.272 V) (I – 0.04 T),
where V and T are the wind speed (m/s) and air temperature (oC), respectively.
The calculation of the severity coefficient (S) was performed using data at the meteorological observation times for Leningradskaya station and for other Antarctic and Arctic stations over a number of years. The most significant S values are observed from May to September. The average severity values for the indicated period comprised 6.5 points for Leningradskaya, 7.4 for Mirny and 9.3 for the Vostok station. Note that the S coefficient at the North Pole in winter (5.3 points) is almost the same as at the Vosok station in summer (5.5 points).
[top]
Clouds and precipitation
A sufficiently high frequency of occurrence of overcast sky (8-10 tenths) is observed at all stations of East Antarctica, comprising 63% on average for a year for Leningradskaya station. In the summer months, in more than 70% of all observation times a complete sky coverage with clouds is observed while in the winter months this parameter decreases to 55-50%. However, the low cloud frequency is much lower being not greater than 20%.
The clear sky frequency of occurrence in winter and in early spring (including
October) is at the 30% level decreasing in the summer months and reaching
only 15% in January and February.
Middle and high clouds of undulated forms typically predominate in summer.
In winter, the fraction of stratus cloud forms increases. At the deep cyclones
exiting to the coast along the meridional trajectories, the passage of fronts
is accompanied with a continuous multi-layer clouds, which often sinks to
the level of Leningradskaya and is recorded as fog in some cases.
The number of stratus-rain and high stratus clouds in the observation results is probably slightly underestimated since it is impossible to accurately assess the cloud form and height in precipitation and at snowstorms.
Around 150 days with precipitation are observed on average at the station for a year. This number includes all days with snowfall, tapioca snow and granular snow regardless of their amount. Total precipitation sum is consist about 600 mm per year. The 1989 year was the most snowy year when precipitation comprised 830 mm. The maximum precipitation is observed in the summer and autumn months, and namely from January to April when 70-80 mm of precipitation falls out on average for a month. The fact that precipitation in July 1989 comprised 154 mm at the 50 mm norm indicates a large dispersion of precipitation data in individual years. This is due to the anomalous high frequency of occurrence and intensity of the meridional processes in the Australian-New-Zealand sector in the indicated month. On the other hand, it is necessary to remember that at strong blowing and general snowstorms, snow is both blown to and out of the snow gauge bucket.
Note that at the storm wind and general snowstorm, abundant deposition of granular rime is observed, which is probably connected with a cloud passing across the station. The number of days with rime is about 100 a year reaching in some months especially in summer and autumn 10-15 days and more.
[top]
Visibility – snowstorms, fog and whiteout
There are good conditions for observations of visibility at the Leningradskaya station as there is a sufficient number of orientation marks both at the station, near the station (for example, a island in 2 km) and at some distance: the mountain tops in the southwestern direction are located in 8 and 19 km. The farthest object that is seen at very good visibility is located at a distance of 38 km. This is the Governor Mountain. The frequency of occurrence of visibility of more than 10 km comprises 86-93% of all observation times in the spring and autumn months decreasing in winter and summer. The worst visibility over the period 1971 to 1979 was observed in December when the frequency of occurrence of good visibility was 75% and that of poor (less than 1 mile) visibility was 22%. The main factor restricting visibility is snowstorms. The number of days with snowstorms obviously increases in winter reaching 15 whereas in summer it is about 10. Note a peculiarity of determining the meteorological visibility range related to a high location of the station. In the presence of clouds below the station and in the absence of other meteorological phenomena, visibility is reduced to 2-4 km whereas at the blowing snow (weak and even moderate), visibility of up to 15-20 km is often preserved. The average number of days with snowstorms is more than 140 a year. In 1989, there were 149 days with snowstorms, 41 day of them with general snowstorms. An example of the quiet year is 1974 when the number of days with snowstorms was only 62.
Frost fogs are rare at the station (on average 1-2 cases for a winter month). They occur under the low wind conditions when the amount of clouds is small at the significant air temperature decreases. In summer, the number of fogs increases due to advective sea fogs as well as at running of low stratus clouds onto the station area. Typically in December and January up to 10 cases a month is recorded. In January 1972, 17 days with fog and in January 1974, 14 days were recorded.
[top]
Sea ice
The ice regime of the coastal area of the Somov Sea at the radius of about 60 km from the Leningradskaya station is exclusively peculiar.
One of its typical features is a very early onset of ice formation. In most years, it occurs already in mid-February and in some years even during the second half of January. This is primarily attributed to the decreased summer heating of the surface sea layer due to a constant preservation here of the Balleny ice massif.
Thus, during the entire 20-year operation of the station (1971-1991) no complete ice clearance (at least short-term) of the area in question was recorded. Moreover, on average up to 60% of its area by the moment of new ice formation was typically occupied by residual drifting ice of the southern periphery of the massif and often by landfast ice that was preserved over 20% of the area east of the station near the barrier of the Gillett Ice Shelf.
However, in January-February, a predominantly continuous polynya with a total area of up to 1.5 thousand km2 exists directly along the glacial-landfast ice coast between 158-160°E. The polynya has a wedge-like form at which its width comprises 30 km on average in the west behind the outlet Tomilin glacier, around 10 km opposite the station and decreases to zero near the landfast ice edge in the vicinity of 160°E.
An unusually early even for the Antarctic intense ice formation developed in the polynya proper, occurring at first only at night hours due to radiation cooling. It can also be suggested that strong local freshening of the shelf zone contribute to this due to the discharge of a large volume of sub-glacial melt water along the channels of numerous outlet glaciers in this region.
Formation of new landfast ice begins vice versa quite late in mid-April approximately almost in two months after the onset of ice formation. The landfast ice expansion is interrupted with frequent breaks of its marginal area.
As a result, the landfast ice often reaches its maximum dimensions only in late July, when the last area of the aforementioned summer recurring polynya west of the Tomilin glacier finally freezes. The width of the stabilized continuous landfast ice band varies during August within 50-60 km. Continuous drifting ice with 100% concentration is located behind landfast ice.
However sometimes irreversible landfast ice edge breakup begins already in September and in late October-early November a complete decay of its westernmost segment behind the Tomilin glacier usually occurs. Here, a recurring near-glacier polynya with average dimensions 20x15 km appears again at the place of broken and exported landfast ice. Offshore catabatic winds keep its surface ice-free.
The breakup of the main landfast ice belt east of the station combined
with expansion of recurring polynya typically extends up to late March of
the next year.
During the 1971-1979 period, the breakup process never ended with the final
landfast ice breakup. A landfast ice segment directly under the station and
east of it with a length up to 70 km and a width of 10-20 km was steadily
preserved by a concentration of icebergs grounded in coastal shallow water.
Multiyear landfast ice was predominantly comprised of ice more than 10 m
thick whose age in 1971 was estimated as 10-12 years old.
In 1980-1987, the landfast ice was completely destroyed every year. From
1988, a tendency for formation of multiyear landfast ice in this region was
again observed.
Based on data of few measurements, first-year ice formed in the vicinity of
Leningradskaya station in April (see above), grows by the early December on
average up to 1.5 m differing in increased snow concentration of about 50
cm.
The period of its melting is obviously restricted to only one month - approximately from mid-December to mid-January. The decrease of landfast ice thickness for this time comprises not more than 10 cm.
The growth of unbroken landfast ice is already observed in mid-January. Probably, it grows both from the top due to freezing of the lower wet snow layer at night hours and from the bottom due to frazil ice formation developing as a result of strong freshening.
In case of landfast ice preservation, it reaches the thickness of not less than 2 m at the second year of its existence and is probably not subjected to melting at all.
[top]
Photo Gallery
|
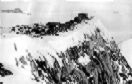
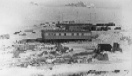
General view of the station in 1974 (photo by V.V.Evseev) |
|
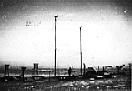
General view of the meteo place of station (photo from archive) |
|
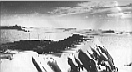
General view of the station in 1971 (photo from archive) |
|
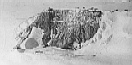
General view of the west part of the station (photo from archive) |
|
General view of the east part of the station (photo from archive) |
|
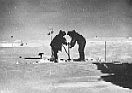
Ice measurements (photo from archive) |
|
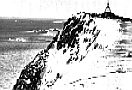
mark "Nikitovich" (photo from archive) |
|
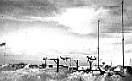
Meteorological place. General view from North-Western part. August 1971 (photo from archive) |
[top]