 |
Station Vostok |
[Clouds][Precipitation][Visibility and fogs][Dangerous phenomena]
[Meteorological support of flights][Photo gallery][Climatological data]
see also: [Subglacial Lake Vostok]
| Station synoptic index | 89606 |
| Meteorological site height above sea level | 3488 м |
| Geographical coordinates | 78°27' S 106°52' E |
| Geomagnetic coordinates | F = -89.3°; D = 139.5° |
| Beginning and end of polar day | 21 October - 21 February |
| Beginning and end of polar night | 23 April - 21 August |
Vostok area
The Vostok station was opened on December 16, 1957. It is located on the snow surface of the ice plateau of Central Antarctica (with coordinates of 78 28'S and 106 48'E) in 1410 km from the Mirny station and in 1260 km from the nearest sea coast. The station height above sea level comprises 3448 m. The ice sheet thickness in this area is 3700 m.
The highest part of the ice plateau is at a distance of 450 km to the west-southwest of the station at the height of more than 4000 m above sea level. The station is located on the snow plane with a general insignificant eastward gradient presenting a slope of the main ice divide of the continent. Snow sastrugi and naduvy (blown snow fields) are typical micro-relief features of the snow surface in the station vicinity forming a slightly undulated surface. The height of sastrugi typically varies between 20-40 cm and that of naduvy is not greater than 50 cm.
The inland research station Vostok is one of the major base stations of Russia in Antarctica. The following year-round observations at Vostok are undertaken:
Meteorological and actinometric observations, snow line measurements; Total ozone content measurements and observations of the anomalous phenomena in the atmosphere; Geomagnetic observations, including ionosphere studies and observations of atmospheric electrical field variations; Upper-air sounding of the atmosphere; Deep drilling of the Antarctic ice sheet. Based on the deep-drilling results, a sub-glacial lake was discovered whose study is continued; Study of the influence of environmental factors and micro-social conditions on the health of the RAE participants.
[top]
Temperature regime
The annual temperature variations are typical with the maximum in summer and the minimum in winter. The natural seasons in Antarctica are divided conventionally by the character of the temperature and illumination changes. A peculiar feature consisting in the absence of a pronounced minimum in one of the winter months, distinguishes annual variations. The difference of average temperatures of any two adjacent months is not greater than 2.0o C. Frequently in the middle of winter, warm periods (cores) occur that are also clearly pronounced in the middle troposphere being due to heat advection at intensification of the meridional form of atmospheric circulation. Such processes with active cyclonic eddies exiting to the station area are more often observed during the colder period than at the warmer time.
Similar large-scale warming with record high air temperatures both near the surface and in the troposphere was observed at some stations of East Antarctica at the beginning of January 1974, while at the inland Vostok station a new record of –13.6o C was observed on January 5, which exceeded the absolute air temperature by 7.3o C.
This process was preceded in late December 1973 by generation of a strong blocking ridge in the middle troposphere (AT 500) and near the surface south of Tasmania Island. As a result of meridional cyclonic activity development, there was a stable transfer of warm air masses along it western periphery. This in turn, contributed to the formation of an extensive surface anticyclone above East Antarctica near the Dumont d’Urville station. Intensifying, it slowly moved southwestward towards the Vostok station. At the time when the anticyclone center was located east of the station, the transfer of warm and moist air masses from the north along its western periphery was most intense. With the anticyclone center passing across the Vostok station and establishment of southerly winds whose speed increased up to 18-22 m/s, the temperature sharply dropped for two days.
The formation of ridges and heat sources in the upper troposphere above Antarctica begins more frequently in the Indian-Australian sector of the Southern Hemisphere. This is primarily connected with a large frequency of occurrence of cyclones compared to other regions, governing intense meridional air exchange processes in the troposphere and lower stratosphere.
In April, the average monthly temperature at Vostok drops below –65 C and remains at this level throughout the entire winter. In some years, the mean monthly temperature in June-September can be below –70C. August is the coldest winter month (-68.6 C) when the atmosphere cooling above the mainland achieves its maximum persisting during the entire polar night.
Transition from winter to summer is characterized by a steady and significant air temperature increase in respect of absolute values. The mean temperature of the first spring month (October) is 9.7C higher than in the last winter month (September). From September (-65.8C) to December (-32.9C), mean air temperature increases almost two-fold.
In the middle of the polar day, in summer (December-January) the temperature is the highest not dropping below –36o C on average, over a month. The highest temperature is observed in late December-early January indicating a direct relation to the Sun’s elevation above the horizon. Abundant and uniform incident solar radiation determines not only relatively high temperatures in summer, but also an insignificant difference between mean temperatures of the summer months (0.2C).
Beginning of autumn is accompanied with dramatic cooling. The average temperature in February is 11.3o lower compared to January. The lowest mean monthly temperatures in autumn are recorded in March (-61.8C) with the highest temperatures (-42.7C) in February.
The temperature regime of transient seasons is characterized by sharp variations in the middle of each season. Mean monthly temperatures in spring (October to November) increase and in autumn (February to March) decrease by the same value comprising 13.4C).
The mean annual air temperature anomalies vary from year-to-year between 2.1C to –1.4C. The daily temperature variability is small with mean values comprising 4.5C in winter, 1.4o in summer and 2.6o in the intermediate seasons. This indicates the increased activity of the inter-latitudinal exchange of air masses in winter and a significant role in these processes of advective heat transfer by cyclonic eddies moving along the meridional trajectories to the inner areas of the continent.
[top]
Surface wind and air pressure field
Winds in Central Antarctica are much weaker than at the coast. The wind regime at Vostok station is characterized by weak catabatic southerly-southwesterly winds with a mean annual speed of 5.0 m/s. Annual wind speed variations have two pronounced maximums (March and September) and one sharp minimum (January). The highest mean monthly wind speed is observed in September (5.5 m/s). The calmest month is January. The multiyear wind speed is 4.2 m/s.
The maximum wind speeds are small comprising 13-14 m/s and sometimes 16-18 m/s. They can in individual cases reach 20-25 m/s. The maximum wind speeds are observed in all seasons of the year being due to the most active cyclones exiting from the Antarctic coast to the mainland.
The probability of storm winds throughout the year is small (only 0.1%). The probability of calms and of strong winds of around 11-15 m/s is also small comprising 2.7% and 1.3%, respectively. Weak winds (0-5 m/s) are predominantly observed in summer and autumn whereas stronger winds (6-15 m/s) in winter and spring.
The Vostok station is located near the eastern foot of a giant spur extending northward from the central dome of the ice sheet of East Antarctica. The prevailing weak southwesterly winds here are determined by downward cold air sinking along the ice spur slope. The persistent wind directions and speeds and dependence of their direction on the area relief indicate their catabatic nature. These winds also possess the external features of catabatic winds. Compared to the winds of other directions (gradient and cyclonic), they are colder and total cloud and air humidity at these winds are smaller with greater frequency of occurrence of clear weather.
However, the main indicator of catabatic winds is absent in these winds, and namely, the maximum of daily speed variations is observed in the daytime, rather than at night like in real catabatic winds. Such daily wind speed variations are observed at the station in all months except for April, June and September. This is of the presence of a strong surface High in Central Antarctica in whose system the gradient winds are developed due to the anticyclonic pressure field.
In spite of being significantly remote (about 1300 km) from the shores of the Indian and Pacific Oceans and a large elevation of the station above the ocean level, this area as mentioned above, is subjected to the influence of coastal cyclonic activity. The cyclones penetrating the continent both from the Indian Ocean coast and the Ross Sea, reach the station. The influence of the latter in the form of the frontal zones reaching the station area, is primarily manifested in a sharp deterioration of weather conditions accompanied with increased cloudiness, temperature and westerly, southwesterly wind speeds up to 18-20 m/s. The cyclones coming occasionally from the Indian Ocean also bring cyclonic weather to the station area but with easterly winds. Their speeds are attenuated by contrary catabatic winds and are hence low (8-10 m/s), but the other indications of cyclonic features are quite pronounced.
The existing sink in the station area is screened by a coincidence with the gradient wind and a superposition in some cases of cyclonic winds. These effects are so strong that they distort the daily speed variations typical of the catabatic winds. However, the catabatic wind preserves all its other indications at the Vostok station. In summer, the frequency of occurrence of cyclonic winds similar to the other Antarctic stations increases and that of catabatic winds decreases while in winter it is vice versa.
Due to a high station elevation above sea level, the atmospheric pressure
here is very low comprising 624.2 hPa on average for a year. It varies
little in individual years. The annual variations like in other mountain
countries have one maximum in summer (January) and one minimum in late
winter (September).
The variability of mean monthly pressure values has annual variations
with the winter maximum and summer minimum. The largest deviations are
typical of the entire cold period (autumn-winter) with dominating anticyclonic
weather conditions. However, the largest frequency of occurrence of cyclonic
activity is also observed at this time governing thus the significant amplitudes
of atmospheric pressure reaching 20 mb.
[top]
Clouds
Due to extremely low air temperatures, the clouds present ice clouds in the station area and only in some cases, clouds comprised of supercooled water droplets can occur. Lower level clouds (stratocumulus) occur very seldom above the high mountainous Antarctic plateau where the station is located. Their frequency of occurrence comprises only 1.2%, which is natural as the plateau surface lies above the boundary of lower-level cloud formation and only on some days, the convective flows above the surface can occur contributing to their appearance.
Stratus clouds that have the largest frequency of occurrence in summer and in the intermediate seasons (1.3%) and the least (0.4) in winter are more frequently observed. At these clouds in summer, the atmospheric pressure (638.6 mb), air temperature (-30.9C) and absolute humidity (0.37 mb) are greater than in winter, when they comprise 623.1 mb, -65.0o and 0.01 mb, respectively.
Middle clouds are recorded more often, their frequency of occurrence comprising 8.5%, on average for a year. The prevailing cloud family in the station area is high-level clouds, whose frequency of occurrence for a year comprises 52.9%. The frequency of occurrence of clear weather comprising 37.4% is likewise high. The largest frequency of occurrence of clear weather throughout the year is in winter (41.6%) with the least in spring (30.8%). In winter at clear sky, the weather is characterized by high wind speed (5.4 m/s), but low pressure (620.0 mb), temperature (-68.8o) and humidity (absolute – 0.00 mb and relative 66%). In summer, there is a low wind speed (4.7 m/s), but high air pressure (631.0 mb), temperature (-33.5o) and humidity (absolute 0.30 mb, relative 74%).
The undulated cloud forms (Ci, Cc, Ac, Sc) have the largest frequency of occurrence in summer when the air above the Antarctic Plateau warms noticeably. The largest (39-42%) frequency of occurrence of cirrus clouds is observed not only in the summer, but also during the intermediate seasons. The least frequency of occurrence of cirrus and cirrocumulus clouds is recorded in winter while that of high cumulus and stratocumulus in spring.
The frequency of occurrence of stratiform clouds (Cs, AS) is characterized by inverse annual variations. Whereas for high stratiform clouds such annual variations are pronounced, the frequency of occurrence of Cirrostratus has two phases during the year: maximum in winter and spring (18.4-18.2%) and minimum in summer and autumn (12.3-12.5%). At stratiform clouds, the atmospheric pressure is lower (624.2 mb) on average for a year, compared to undulated clouds. The temperature is slightly less (-54.5C), but the wind speed (5.5 m/s) and especially total cloudiness (8.1 tenths) is much higher. The absolute humidity comprises 0.07 mb with relative humidity of 72%.
Large values of total cloudiness and wind speed at stratiform clouds confirm that this form belongs to the frontal system clouds. They result from interaction between the cooled surface of Antarctic Plateau and a relatively warm air flowing onto it. Their prevailing frequency in winter points to dominance of meridional intrusions of comparatively warm air masses in winter from the ocean to the continent.
[top]
Precipitation
The mean annual sum of precipitation from the atmosphere is 37.9 mm while that of accumulating on the sow surface comprises 21.5 mm. The sum of precipitation falling out from the atmosphere is non-uniform throughout the year comprising on average 4.7 mm during one month in winter, 2.0 mm in spring, 0.6 mm in summer and 2.2 mm in autumn. The main amount (75% of the annual sum) falls out in winter, being especially intense in September, which is distinguished by increased cyclonic activity. On average for a year, there are 26 days with snow, 247 days with the atmospheric fallout of ice needles and 225 days with deposition of hoarfrost. The duration of precipitation is quite large, its intensity however, being so small that in respect of the total annual precipitation the station area can be compared to the quite arid Earth’s regions.
The meteorological conditions under which it snows differ sharply from the weather accompanying the fallout of ice needles and deposition of hoarfrost. At snowfalls, the air temperature and humidity are much higher (with total cloudiness twice as large) than at the other kinds of precipitation during all seasons of the year.
The weather at the fallout of ice needles is almost similar to hoarfrost deposition conditions, the only difference being a slightly greater frequency of clear weather and middle clouds (along with lower clouds in winter and spring) and greater air humidity and wind speed. Similar weather conditions at these types of precipitation are understandable as the fallout of ice needles and deposition of hoarfrost occur very often simultaneously.
The occurrence of ice needles is determined by sea air flowing to the inner regions of the cold mainland at the elevations of about 500-1000 m above the ice sheet surface and its sinking due to downward flows.
[top]
Visibility, snowstorms and fogs
The atmospheric transparency in the inland region of Antarctica is very large. Practically except for water vapor and ice crystals, the air is not polluted with anything. But humidity here is less than anywhere else since precipitation is insignificant and snowstorms are rather rare. Therefore, the meteorological visibility in the station area is quite high. The largest frequency of occurrence of good visibility (of more than 10 km) is observed in summer while that of poor visibility (of up to 1 km) is the largest vice versa in winter and minimum in summer.
Snowstorms in the station area are seldom due to weak winds. Drifting snow occurs more frequently at the wind speed of up to 8 m/s and the snowstorms at the winds of more than 9 m/s. The frequency of occurrence of snowstorms changes depending on the snow surface state by seasons of the year. In spring and in summer, when the snow surface is covered with the radiation crust, the frequency of occurrence of snowstorms is minimum. The largest frequency of occurrence of snowstorms is recorded in winter when surface snow is not consolidated.
There are 106 days with drifting snow on average over a year. Blowing snow is most frequent (50 days a year). The snowstorms with snowfall are observed as single cases and not every year. General snowstorms and snowstorms with snowfalls significantly deteriorate visibility being mainly caused by active cyclones moving along the meridional trajectories and penetrating deep to the continent determining strong wind at the station. This is related to the situation where the New Zealand High ridge above the Ross Sea develops and intensifies. The development of this typically altitudinal ridge leads to the cyclone near the Balleny Islands exiting to the ice continent. The Vostok station in this case is located at the southwestern periphery of depression. The transformed Antarctic sea air flows along the western ridge periphery to the continent bring middle and high-level clouds to the station, cause snowfalls, snowstorms, wind change to stronger southerly winds and visibility deterioration up to 2-4 km and less.
Fogs and haze produced by ice crystals are typical of the inland regions of Antarctica. There are 42 days with fog and 166 days with haze on average for a year. In summer, fog is observed one day a month while during the other seasons, fog in the station area is observed 4 days a month. The largest number of days with haze is 16 a month in winter and minimum 8 days a month in summer. Average duration of fog and haze is also the largest in winter and the least in summer. Fog and haze form in the Antarctic High at calm and cloudless weather.
Especially dangerous phenomena at the station
Especially dangerous phenomena include low air temperatures, the more so if they are accompanied with increasing wind. For example, the temperature below –75o C at the wind increase of up to 11 m/s was observed at the station in August 1978. Under such conditions, the time of staying in the open air of people is significantly limited. By the maximum permissible duration of stay outside buildings is meant the time over which the initial human body surface temperature will decrease to the value dangerous for health.
A dangerous phenomenon such as snow fog is also quite frequent. It presents the formation of the finest indiscernible by human eye snow particles and ice crystals above the snow surface due to water vapor sublimation at strong surface inversions. The horizontal visibility decreases to 1 m. The snow fog unlike the ice fog and the clouds near the snow surface never produces a halo around the Sun.
At calm weather, frost or ice fog and haze occur in the central parts of anticyclones and ridges. At the wind speed of 3 to 5 m/s, a phenomenon of the “snow mist” can occur caused by fine snow dust in the air after the snowstorm or at the formation of the snow fog. The visibility during the “snow mist” like in the presence of the snow fig disappears. The absence of visibility makes the snow mist an especially dangerous phenomenon.
The “whiteout” belongs to the most dangerous phenomena for aviation, which is due to monochromatization of the incident and reflected light and is expressed in the loss of contrast between an object and the background and the sky and the snow surface that become indiscernible. Good visibility at the whiteout is preserved only for dark objects. Due to the absence of contrast between the snow surface and sastrugi on it, nothing is seen even under the feet. The whiteout is possible at the complete sky coverage with cirrostratus and high-stratus clouds.
[top]
Meteorological support of flights along the Mirny-Vostok route
During the 1960s-1980s, the resupply operations of the Vostok station and rotation of personnel were carried out from Mirny. The flights of IL-14 along the route were carried out in summer on a regular basis. Hence, considerable experience was gained in respect of their meteorological support. Typically, if clouds of 7-10 tenths above 600 m at the 4-10 km visibility were forecasted for not less than 12 hours at the point of aircraft reception (Vostok) and end landing (Mirny), the flight was permitted. If continuous cloudiness below 600 m was predicted with expected visibility deterioration up to 1-2 km and less, the flight was cancelled. The synoptic situations considered below can serve as the weather deterioration indications.
An obligatory flight condition in the 1960s-1970s was cloud-free weather or with few clouds, as the flight was performed visually following the trace of the sledge-tractor train traverse. At continuous cloudiness, the horizon combines with the snow surface and the orientation conditions are extremely difficult.
In recent years, the service of the Mirny-Vostok air-route is facilitated by the introduction of new radio-navigation means providing the possibility for flights under the cloud conditions. However, the crews preferred flying in the weather with few clouds. Note that at clear weather, an inversion film (thin layer) of stratus cloud can form along the route that makes difficult the flight conditions. Its upper edge is observed at the 100-200 m altitudes with the lower edge located almost near the earth’s surface. The most difficult is the segment at the approaches to Vostok at a distance of 150-250 km. The film on this segment becomes even thinner (about 20-25 m) and denser. The underlying surface cannot be seen through it. The temperature in the film layer varies between –35 C to –25 C.
We shall consider the most unfavorable situations at the Vostok station when weather deteriorates making flights impossible. At weather deterioration at Vostok connected with the meridional atmospheric circulation form in the western Pacific Ocean, when a developed Pacific ridge induces the cyclone to exit to the Ross Sea and penetrate the continent, the flights should be cancelled. During this situation, one observes cloud running and snowstorms at Vostok, sometimes with snowfalls.
Another case of weather deterioration at Vostok is connected with the synoptic situation when an extensive deep cyclone persists in the area of the Australian station Casey or exits through this coastal segment to the continent. At this type of circulation, the outflows of warm transformed oceanic air masses to the inland regions also reach the Vostok station resulting here in cloud running and visibility decrease due to wind increase. The prognostic indication in this case of weather deterioration is the change from northerly to southerly wind at altitude. Typically, even at cloud running without precipitation and visibility deterioration the flight is cancelled due to the absence of shadows on the underlying surface that makes landing complicated.
One can hope that when the new flight route to Vostok from the airfield planned at the Progress station is explored, the experience of forecasters gained in previous years will be useful in spite of the improved up to-date flight navigation support.
In the Mirny area in summer, the high- and middle-level clouds prevail. Low clouds of stratocumulus or stratus rain forms run to the coast from the sea, their height being 600-1000 m or less frequently 300-600 m. The cloud height below 300 m is rare.
The occurrence of low clouds is often accompanied with snowfalls (rain is extremely rare). Such weather is typically observed at deep cyclones exiting to the Pravda coast, mostly of polar-frontal origin during the periods of development of meridional circulation in the Indian sector of the Southern Hemisphere. Shallow cyclones of the Antarctic front rarely cause significant weather deterioration. The largest number of clear days a year at Mirny is observed in summer. The southeasterly winds prevail, the easterly and south-southeasterly winds that are typically connected with cyclone passing near Mirny, being more rare. The average wind speeds comprise 7-10 m/s. Visibility is usually good since abundant snowfalls and snowstorms, as well as fogs are not frequent. Thus in summer except for rare cases of passing deep cyclones, the meteorological situation in Mirny is favorable for aircraft takeoffs and landing.
[top]
Photo gallery
 |
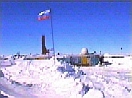
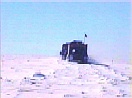
General view of the station (photo from archive) |
 |
Pointer of the station Vostok (photo from archive) |
 |
Tracktor train approaching station (photo from archive) |
 |
Landing of C-130 aircraft (photo from archive) |
 |
Polar staff on rest (photo from archive) |
[top]